To reach its position as leading leaf ex-
porter in the world, Brazil managed to bring
together two important advantages: the
sense of opportunity and the competence to
adapt to a new and more profitable market.
In the 1960s and 1970s, political turbulence
and a civil war in Rhodesia, now Zimbabwe,
paved the way for South Brazil to produce
a superior type of tobacco to meet interna-
tional demand.
This made the American varieties gain mo-
mentum in Brazilian agriculture, like Virginia,
flagship of the crop and national exports un-
til now. With Zimbabwe going through a peri-
od of social unrest, production in that African
country dropped considerably. As multina-
tional companies had already settled in San-
ta Cruz do Sul (RS) and they had perceived
the opportunity, new techniques were intro-
duced to improve the Brazilian crop. In South
Brazil, Amarelinho tobacco predominated,
among other varieties of low commercial val-
ue, known as filler tobacco. The region had a
share in the international market, but both
volumes and values were negligible.
Iro Schünke, president of the Interstate
Tobacco Industry Union (SindiTabaco), re-
calls that he started in the sector in the 1970s
and followed closely all this transformation.
With the lower production volumes in Afri-
ca, Brazil had to make heavy investments in
technology. This involved such questions as
planting, managing, harvesting and curing.
“It was an entirely new process and there
was great expectation as to the capacity of
the sector in absorbing these great chang-
es in a short period of time”, he recalls. In
three consecutive growing seasons, howev-
Taking advantage of the
opportunity
Brazilian25-year hegemony in leaf exports startedwhenRhodesia
(nowZimbabwe) failed to supply the foreignmarket
Systemwent
through
deep transformation
in the 1970s to
continue competitive
er, all these processes had been conquered
by the supply chain. “The integrated system
and the presence of the technical assistants
at the farms, along with the farmers’ willing-
ness in complying with the new practices, are
factors that made all the difference”, he says.
Darci José da Silva, agronomic engi-
neer and technical advisor at SindiTabaco,
recalls that at the beginning of the Virgin-
ia crops, there was no sucker control, nor
was the flower removed. “Then we start-
ed to use sucker controllers and introduced
the topping procedure, and research provid-
ed information relative to fertilization, space
between rows and plants, and a set of man-
agement techniques which resulted into
crops of excellence in the region, with tobac-
co reaching better style, fetching better pric-
es and produced at lower costs compared to
the United States”, he clarifies.
When the market realized that tobacco
produced in Brazil matched the quality of the
tobacco produced in the United States, but
at lower costs, international demand began
to soar. Schünke emphasizes that, following
on the heels of this situation, many compa-
nies started operating in Brazil, attracted by
the new scenario, which transformed the Rio
Pardo Valley in one of the most developed
economic regions in the Country.
71
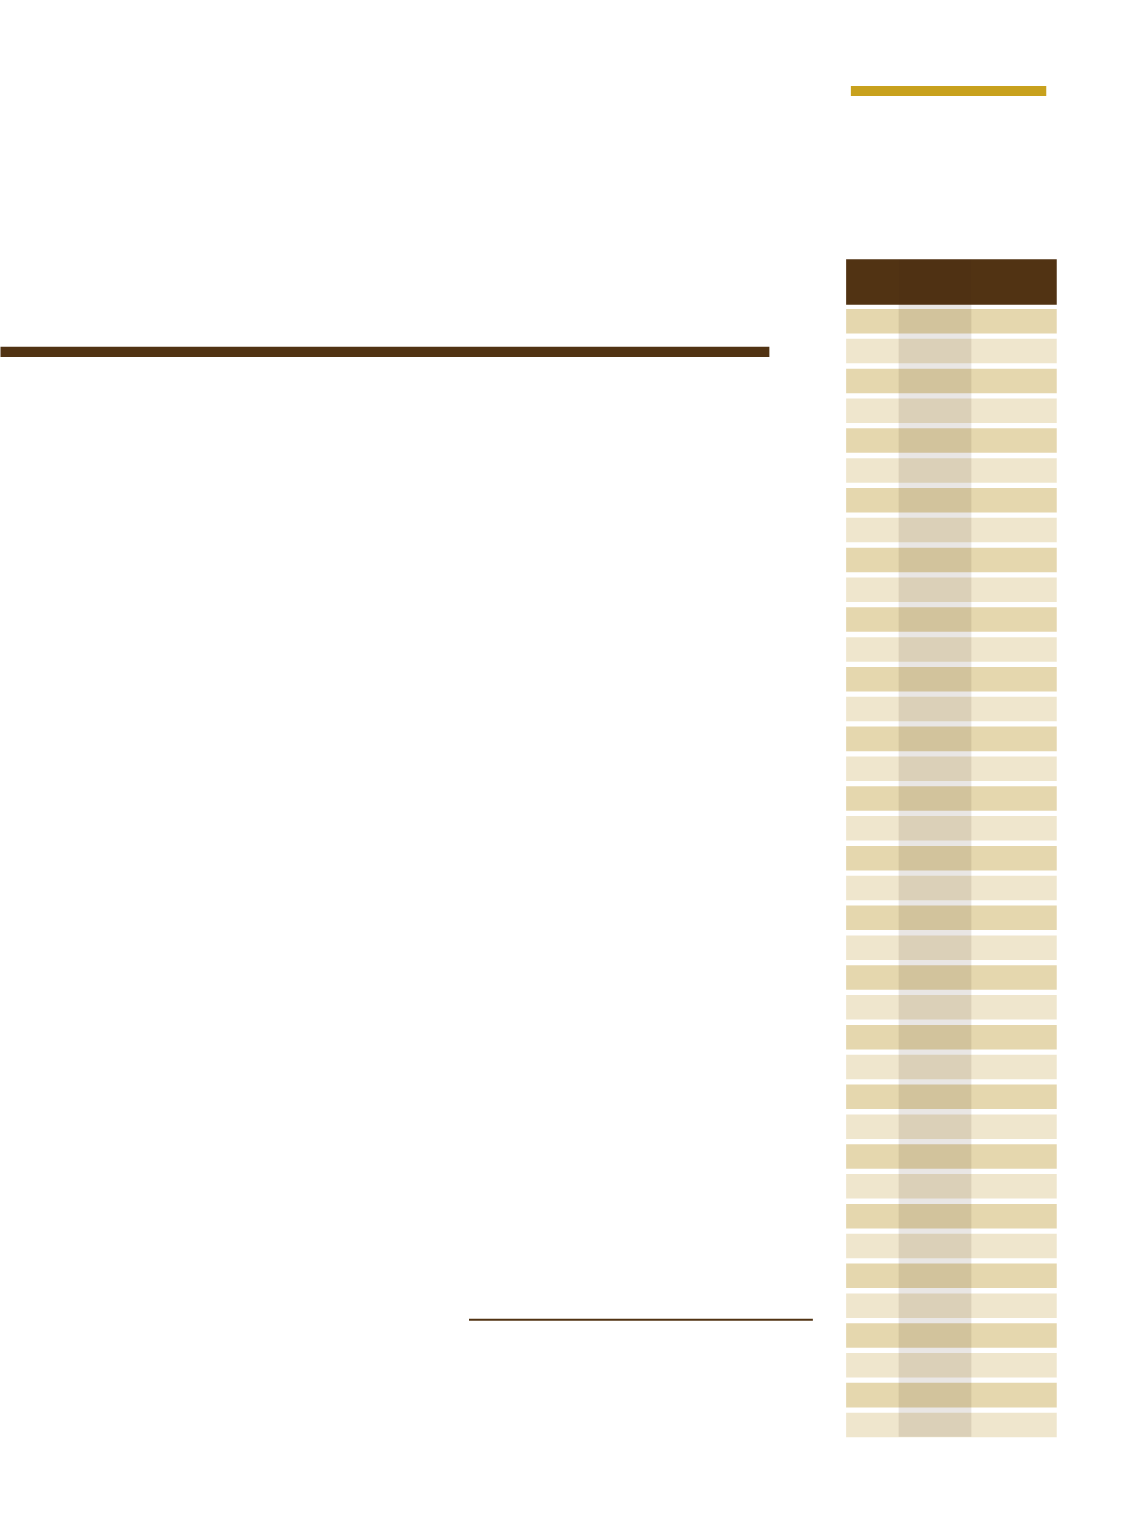
Fonte: SindiTabaco.
LINHA DO TEMPO
Time line
Exportações de tabaco
no Sul doBrasil
Tobacco ExportS
IN South Brazil
1979
97.978 222.350
1980
233.355 108.287
1981
299.320 119.448
1982
416.586 137.711
1983
416.252 148.374
1984
416.022 167.842
1985
410.184 174.921
1986
367.737 154.377
1987
383.716 158.173
1988
490.255 182.543
1989
490.594 173.319
1990
169.781 529.881
1991
179.018 658.298
1992
237.686 835.018
1993
216.408 639.063
1994
265.024 676.438
1995
231.780 732.392
1996
258.270 985.871
1997
306.155 1.056,6
1998
291.125 960.594
1999
334.306 894.790
2000
340.000 857.500
2001
415.000 962.900
2002
472.000 1.070,0
2003
465.473 1.130,7
2004
589.853 1.488,1
2005
610.453 1.695,2
2006
558.642 1.721,8
2007
599.000 2.200,0
2008
686.000 2.713,0
2009
672.000 3.020,0
2010
503.000 2.730,0
2011
541.000 2.891,0
2012
633.000 3.211,0
2013
624.409 3.240,0
2014
473.088 2.459,1
2015
513.667 2.151,0
2016
480.549 2.091,2
Ano Volume Valor(US$)
Year (T)
Value(US$)


