B
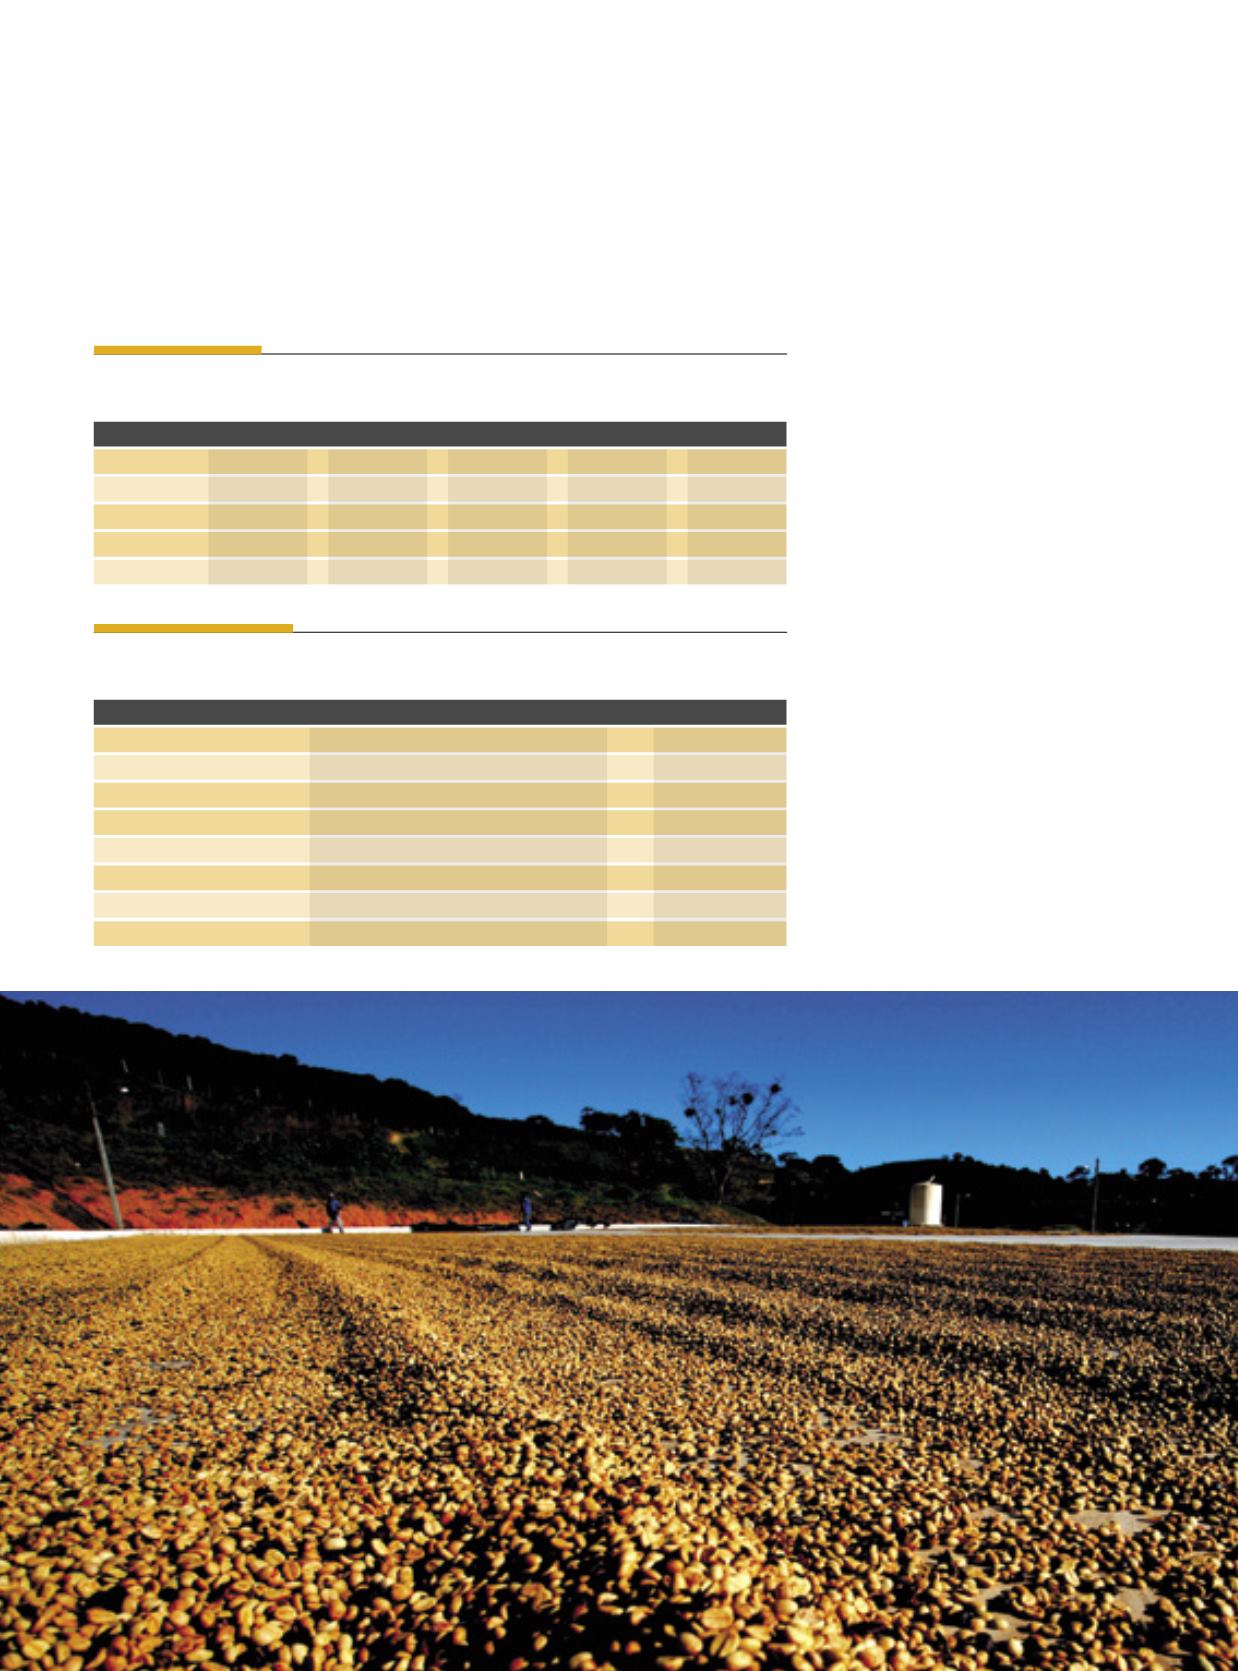
razil hopes to recover (by far)
the shortfall in the amount of
coffee sacks produced in 2017.
The production of Arabica and
conilon coffee amounted to
44.97 million 60-kilogram sacks in 2017,
down 12.5 percent from the 51.37 million
sacks harvested in the previous year, ac-
cording to the National Food Supply Agen-
cy (Conab). The reduction was influenced
by the off-year of low production in the bi-
ennial cycle of the Arabica coffee, respon-
sible for the biggest portion of the nation-
al production volume, 76 percent in 2016,
say Conab sources. Nonetheless, in 2018,
an on-year of large production, the expec-
tation is for the crop to range from 50 to
58.5 million sacks. The highest projection
comes from the Conab, while the lowest
projection was announced by the National
Coffee Council (NCC).
Equally, the area under production,
1.865 million hectares (84.4 percent) in
2017, was down 4.3 percent, say officials of
the government organ. Total plantings oc-
cupied 2.21 million hectares, similar to the
planted area in 2016, of which, 344.92 hect-
ares (15.6%) were still in their development
stage. Conab officials have it that produc-
tivity gains, favored by the adhesion of the
farmers to technological innovation, con-
tributed towards the smaller area under
High
jump
Afterharvesting44.97millionsacksof
coffeein2017,down12.5percent,theBrazilian
cropcouldvaryfrom50to58.5millionsacks
AROMABRASILEIRO•
BRAZILIANAROMA
Produçãonacional de café (arábica e conilon) nas últimas duas safras
Região
Produção (mil sacas beneficiadas)
Variação (%)
Safra 2016
Safra 2017
Norte
1.642,0
1.952,1
18,9
Nordeste
2.093,3
3.358,0
60,4
Centro-Oeste
352,2
281,7
(20,0
Sudeste
46.069,9
38.071,1
(17,4)
Sul
1.047,0
1.210,0
15,6
Outros
164,8
97,1
(41,1)
Brasil
51.369,2
44.970,0
(12,5)
Fonte: Conab, dezembro de 2017.
ABASTECIMENTO •
SUPPLY
Suprimentobrasileirode café (arábica e conilon), milhões de sacos de 60 kg
Safra
Produção Importação Suprimento Consumo Exportação
2012/13
49,1
0,1
49,2
20,3
28,7
2013/14
45,3
0,1
45,4
20,1
32,0
2014/15
43,0
0,1
43,1
20,3
36,7
2015/16
51,3
0,1
51,4
20,5
37,1
2016/17
45,0
0,2
45,1
20,5
33,7
Posição: janeiro/2018. - Fontes: Conab, ABIC, MDIC/Secex, elaboração: SPA/Mapa.
Sílvio Ávila
32


